Claude Skill
Data Visualization Report Skill
Generate visually compelling, presentation-ready HTML reports directly from your data analysis in Claude.
How it works
Generate more visually compelling reports from Claude. Instead of reading through plain markdown tables and text summaries, this skill handles taking your findings and insights and presenting them visually in a clean, structured HTML format. It bridges the gap between raw analysis and a polished deliverable.
Upload your data
Provide your CSVs, JSON, or raw data to Claude within your project.
Describe the analysis
Ask Claude to find insights, trends, or correlations in your dataset.
Get a polished report
The skill automatically formats the insights into a beautiful, self-contained HTML report.
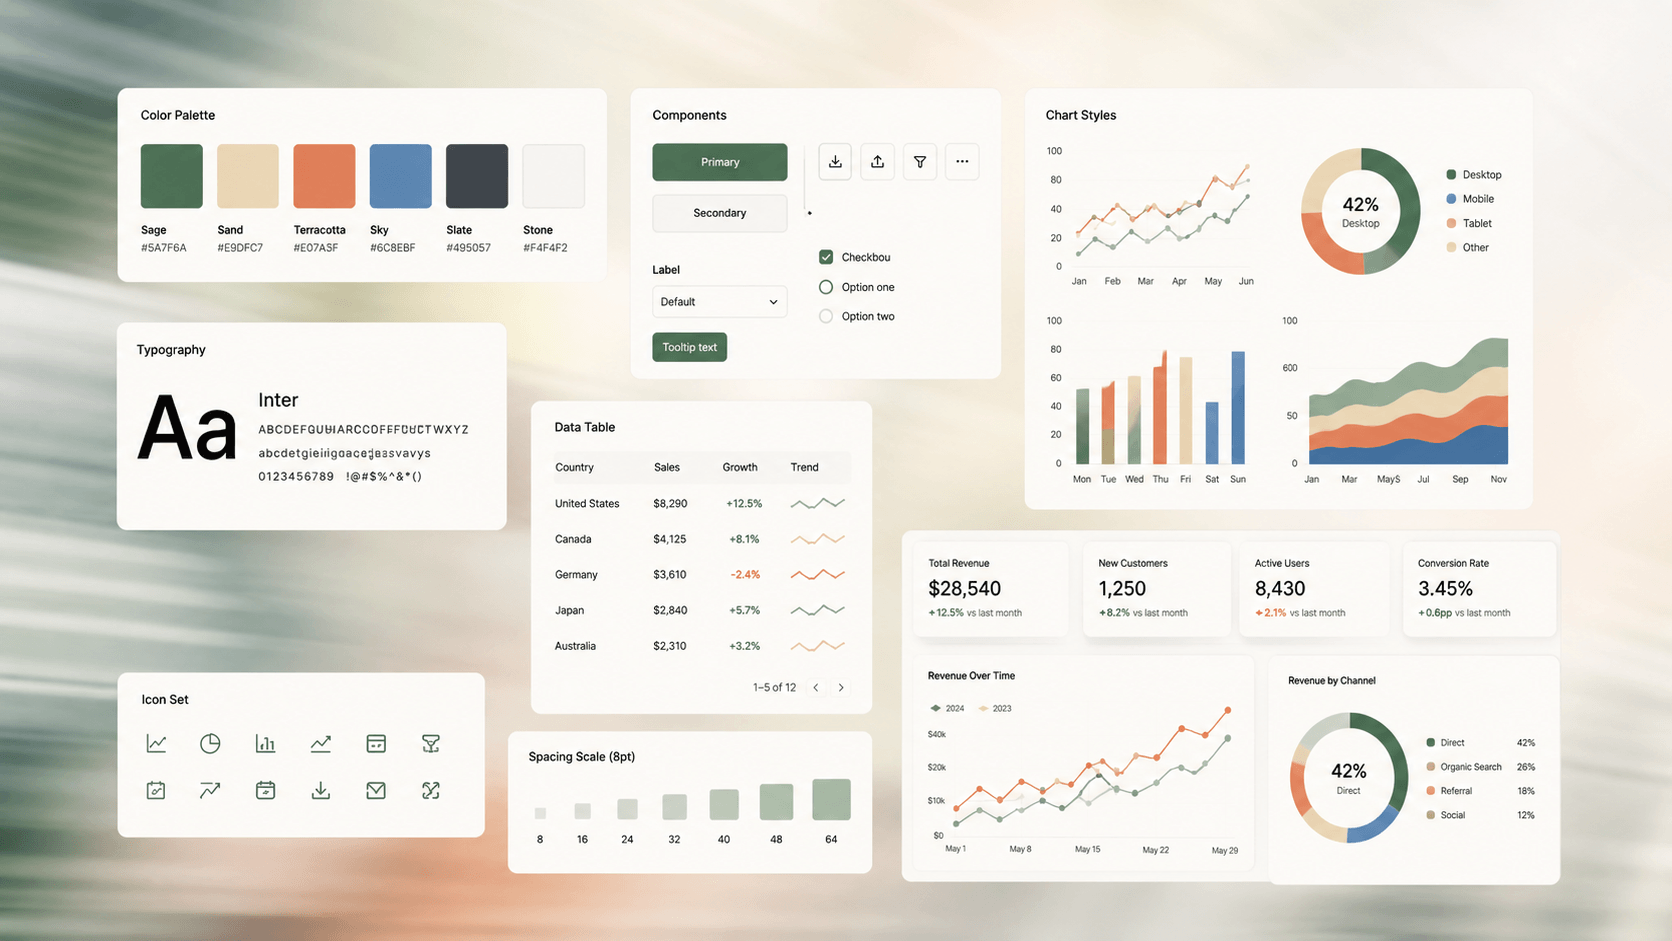
Custom Design System
Built on a neutral, data-first UI
The skill enforces a strict report anatomy built on neutral surfaces. Primary text, muted meta-information, and borders stay neutral so the charts can carry the color.
It features an 8-slot cool-to-warm chart palette, crisp typography using DM Sans and IBM Plex Mono, and seamless integration with Apache ECharts.
Example Reports
Get the Skill
How to install and use:
- Download the
.skillfile using the button above. - Upload the skill to your account on claude.ai (web).
- Upload your data, prompt Claude for the type of analysis you need, and let the skill automatically handle presenting those findings in a polished, presentation-ready HTML report.